Measuring the Networked Nonprofit
24.1K views | +0 today
Follow
Measuring the Networked Nonprofit
Best links and resources for improving practice and proving results.
Curated by Beth Kanter
Your new post is loading...
Rescooped by Beth Kanter from visual data
Scoop.it!

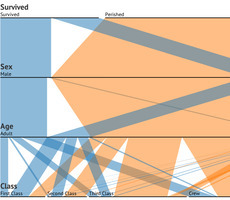
Visualizing Connections In Data & Analyzing Information

Visualizing Connections In Data & Analyzing Information | Measuring the Networked Nonprofit | Scoop.it

For many data visualization projects, information comes from a source that has already done some aggregation. This is both a blessing and a curse. Aggregation definitely simplifies the analysis and visualization process, but it can also greatly reduce the visualization and analysis options. This is because aggregation often destroys connections in data. For this reason, it's critical to have an in-depth and thorough knowledge and understanding of the information from aggregated information. There are several different visualization techniques that open up once we have the original data, such as Euler diagrams and parallel sets.


The extra information that can be obtained from visualizations is important to gaining a full understanding of the data, and it can lead to a much more interesting story, as well as far better visualizations and more accurate connections and links within those visualizations.

So, when gathering data about something, remember to dig deeper into it, as there are many important connections that happen within data that can provide knowledge beyond just a simple average or total.


To learn more about the value of these connections, sourcing accurate data, and how it is transformed into useful graphics, read the complete article and check out the case study used to convey the main points outlined above...


Via Lauren Moss
kurakura's comment, November 15, 2012 5:17 AM
the last graph on that page is really useful for understanding the data?
Scooped by Beth Kanter
Scoop.it!

How To Measure Social Media Efforts | distilled

How To Measure Social Media Efforts | distilled | Measuring the Networked Nonprofit | Scoop.it

Curated by Beth Kanter

http://www.bethkanter.org


This post has a lot of useful links and visual cheat sheets.   The links and key points that caught my eye:


1)  Mangaging the content and social media marketing process

http://www.seomoz.org/blog/define-and-align-a-manageable-content-and-social-media-marketing-process

Awesome visual cheat sheet - see above


2)  Metrics Matter


Identify the best social media channels to suit you. Work to prove the value of one of those channel and then scale up. Of course, this is not to say you should neglect other communities but focus some initial resources towards getting one of your channels working and then look to the others. Building a relationship with your community takes time and there’s no quick fix approach to an effective social media strategy. Dedicate time daily to check in on inboxes, mentions and comments in order to keep up with all of your various sources.


Free Metrics Tool that tracks followers, retweets, and mentions

http://www.metricly.com/


3.)   How To Use Google's URL Builder


Shows how you can track social traffic vs other traffic.


4.)   The importance of staying agile and how it contribues to success - with a terrific word cloud on the qualities of success online


No comment yet.
Rescooped by Beth Kanter from visual data
Scoop.it!

How to Think like a Data Journalist [Datablog]

How to Think like a Data Journalist [Datablog] | Measuring the Networked Nonprofit | Scoop.it

Whilst preparing for her Strata keynote, Google's Kathryn Hurley spent a week with the Datablog team and here are a few key takeaways from that experience...


Exploring the methods and tools that a data journalist uses in their day to day activity at the Guardian Datablog: The fast-paced environment means data analysis tools that are quick and easy to use reign supreme. There are really three major steps of the Guardian Datablog's process that drive the tools and resources they use:

  • Getting the data
  • Telling the story
  • Sharing the data


Read further for more details on the data journalism process and associated resources and links, as well as how you can apply some of these data analysis techniques to your own work...

Via Lauren Moss
No comment yet.
Scooped by Beth Kanter
Scoop.it!

PhilanTopic: Philanthropy’s Data Dilemma

It's not that philanthropy doesn’t have anything to bring to the Big Data party. Think about it. Foundations possess resources, something most people do not. And they possess something even fewer people have, flexible resources. As a consequence they are surrounded by those hoping for their support, an endless stream of the brightest and most committed talent on the planet, people with amazingly creative ideas about how to solve the world's pressing social, economic, and environmental problems. But what's visible to the outside world -- the rare project that is actually approved and whose one-line description eventually makes it on to a foundation tax return and (maybe) a foundation Web site -- is merely the tip of the iceberg. (And a surprising number of foundations don't have Web sites at all.) Moreover, most of the (increasingly digitized) concept notes, project proposals, progress reports, evaluations, research, and strategy deliberations produced by foundations are unavailable for mining within individual foundations, across the field, or by anyone else interested in understanding philanthropy's immense contribution to making a better world.

When it comes to data, foundations have the defects of their virtues. They are endowed, independent institutions with the freedom to innovate, experiment, and stick with challenges for the long run. But their independence too often creates isolation: whatever data they do collect remains locked within thousands of knowledge silos. America's foundations are changing, to be sure, but while many are still focused on catching up with the paradigm shift from giving money away to social investment, the next wave of change is already crashing over them. Either the philanthropic sector masters the technology of managing information and develops the habits of generating and sharing knowledge, or it risks being left behind. Yes, it will continue to do good in the world, but do we really want to settle for being, as Bart Simpson put it, an "underachiever and proud of it?"

That said, getting philanthropy to embrace the era of Big Data need not be a Herculean challenge. Technology is on our side, and by not doing some things we can free up time and resources to start doing others. Here is a partial list of what that might look like.

No comment yet.