Moodle and Web 2.0
166.6K views | +4 today
Moodle and Web 2.0
The use of ITC in the foreign language classroom
Curated by Juergen Wagner
Your new post is loading...
Rescooped by Juergen Wagner from Creative teaching and learning
Scoop.it!

elearn Magazine: Enhancing and impacting the online classroom environment with infographics

elearn Magazine: Enhancing and impacting the online classroom environment with infographics | Moodle and Web 2.0 | Scoop.it

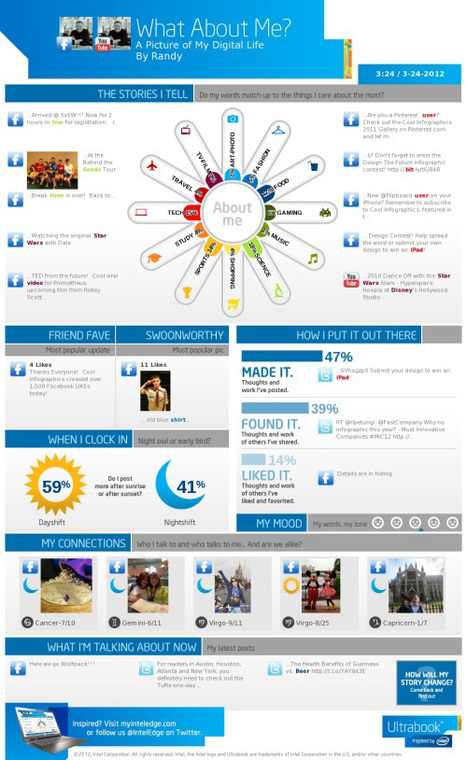
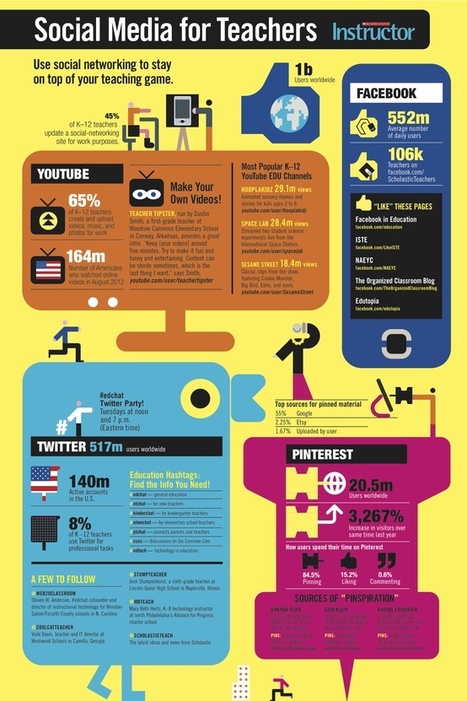
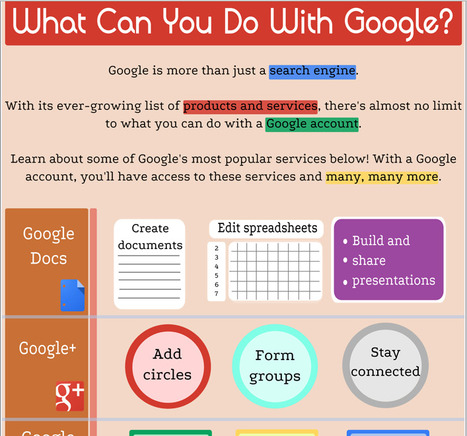
"Throughout history, civilizations have used images to convey their stories. The phrase “A picture is worth a thousand words,” is a manifestation of the power of visual communication. An image can create a sense of clarity by translating knowledge and meaning [1]. An infographic (short for information graphic) is a type of picture that blends data with design ..."


Via Leona Ungerer
Naomi Jehle's curator insight, May 7, 2019 10:35 PM
Creating infographics is visual and appeals to many different students and different learning styles. Visual - is worth a thousand words and can make reading a lot of information far easier on the eyes. 

There are many different ways in which visual elements can be created; although infographics are valuable as they incorporate different elements: words, visual, symbols, and colours. 

The article goes into some detail on how to create effective infographics, which is so valuable. 
Pamela Alaniz's curator insight, May 13, 2019 9:22 PM
This article did mention the use of online classrooms, not Google classrooms per say, but I found it interesting as it noted that learning through infographics was kind of the new way to use graphics with text. I never paid much attention to how I would learn when it came to reading as I would always read the information and answer questions as I was growing up. Now the information I retained was because I was taught and smart enough to retain in my memory, however had it not been for my graduate studies in which I am learning that learning through the use of pictures and simple text is actually getting better retained in my long term memory. This is especially important for teachers who are constructing lessons or multimedia presentations for their students, and come to think of it would help many of the social studies teachers teach objectives to world history if they would use infographics with the use of text versus just text through power points. This would be one way I would change curriculum to help students retain information and not feel to much of a cognitive overload when working, which is another topic this article discusses. This helps readers understand how people learn.
Emily Harvey's curator insight, May 22, 2019 5:06 AM
They say "a picture is worth thousand words"... an infographic must say much more! 
A great visual tool to enhance the classroom environment.
Rescooped by Juergen Wagner from Creative teaching and learning
Scoop.it!

Help students learn better with different types of engaging visuals | Emerging Education Technologies 

Help students learn better with different types of engaging visuals | Emerging Education Technologies  | Moodle and Web 2.0 | Scoop.it

"Today, students have more homework than the generations of students before them. They also have plenty of distractions in and out of the classroom like social media, social media marketers, online gaming and online streaming ..."


Via Leona Ungerer
No comment yet.
Rescooped by Juergen Wagner from Rapid eLearning
Scoop.it!

Animated Cartoon Infographics PowerPoint Template | PowerPoint Presentation

Animated Cartoon Infographics PowerPoint Template | PowerPoint Presentation | Moodle and Web 2.0 | Scoop.it

Animated Cartoon Infographics PowerPoint Template depicts cartoon characters in various moods across animated slides and compatible with Microsoft PowerPoint.


Via FPPT, michel verstrepen
No comment yet.
Rescooped by Juergen Wagner from EDUCACIÓN 3.0 - EDUCATION 3.0
Scoop.it!

How to be a PowerPoint Power User

How to be a PowerPoint Power User | Moodle and Web 2.0 | Scoop.it
Got a presentation to prepare for? Want to avoid 'Death by PowerPoint'? Then read on, we've polled some PowerPoint experts for their tried and tested PowerPoint tips. You'll even discover how to partner PowerPoint with best of breed presentation productivity apps to ensure you are prepared for any occasion.

Via Baiba Svenca, Javier Sánchez Bolado
Mihai Corbuleac's curator insight, January 7, 2016 7:00 AM

Nice infographic, thank you Baiba!

Wendy Zaruba's curator insight, February 2, 2016 10:27 AM

More great tips for using PowerPoint, check them out!

Rescooped by Juergen Wagner from Classe inversée -- Expérimentation -- Recherches
Scoop.it!

10 free tools for creating infographics | Creative Bloq

10 free tools for creating infographics | Creative Bloq | Moodle and Web 2.0 | Scoop.it

...The only problem is, infographics that look like they were simple to make are often anything but. Creating something beautiful and instantly understandable in Photoshop is often beyond the limits that time allows. Which is why it's occasionally useful to use a quick and dirty infographics tool to speed up the process.


We've selected our favourites here. They're all free, or offer free versions. Let us know which ones you get on best with...


Via Jeff Domansky, Marie-Hélène Fasquel-Erhart
Jane's curator insight, August 21, 2014 6:50 PM

Some really useful looking tools 

Miklos Szilagyi's curator insight, August 22, 2014 4:26 AM

I know nothing about this but it looks like a good starting point...:-)))

Luis Cano's curator insight, August 23, 2014 4:02 PM

Herramientas de Infograficas ...

Rescooped by Juergen Wagner from TELT
Scoop.it!

Nik Peachey: Making the most of infographics (webinar tonight)

Nik Peachey: Making the most of infographics (webinar tonight) | Moodle and Web 2.0 | Scoop.it

 The problems associated with reading and retention of dense information on the computer screena shift in the way information is being conveyed through the digital mediumInfographics: a new medium on the internetfactual data that can easily be displayed and browsedan ideal medium for supporting language learning activitieshow to exploit this new medium in the language classroomhow to help to develop our students' visual literacies   Leitung:     Jürgen WagnerReferent:     Nik Peachey   Zugangslink: https://webconf.vc.dfn.de/infographics/   Termin: 25.11.2013 | 19:00 Uhr - 20:30 Uhr


Via Shona Whyte
No comment yet.
Rescooped by Juergen Wagner from Content Curation World
Scoop.it!

Need To Explain To Others What Content Curation Is? Use This Visual Collection

Need To Explain To Others What Content Curation Is? Use This Visual Collection | Moodle and Web 2.0 | Scoop.it
What is content curation about? Diagram, charts and infographics to make sense of the curation conundrum

Via Robin Good
Ali Anani's curator insight, March 4, 2014 12:39 AM

Curate using this visual map

Monica S Mcfeeters's curator insight, March 30, 2014 9:18 AM

This will be helpful to share to those wondering about content curation.

Jeff Domansky's curator insight, September 1, 2014 11:53 PM

Valuable collection of the art of curation from Robin Good.

Rescooped by Juergen Wagner from E-Portfolio
Scoop.it!

20 Reasons Why you Should Use Google Plus [Infographic]

20 Reasons Why you Should Use Google Plus [Infographic] | Moodle and Web 2.0 | Scoop.it

Via Gust MEES, Heinz Krettek
AlGonzalezinfo's curator insight, March 10, 2013 9:05 AM

G+ is catching up big time for many reasons.  Among these reasons is the Hangout integration.  


We just facilitated a remote 1.5 day leadership development session with Hangouts and it was fantastic.  


Google is sticking to their strategy and their value is starting to win people over.  I was never a fan and, through valuable features, I am changing my perspective on the suite of offerings.


This is a relevant infographic.

Penelope's comment, March 10, 2013 6:43 PM
Been thinking about G+. Thanks for sharing, Al. ;)
Shanika Journey's curator insight, March 12, 2013 12:49 PM

NICE ONE! Great reference

Rescooped by Juergen Wagner from Languages, Learning & Technology
Scoop.it!

Free Technology for Teachers: Social Media for Teachers

Free Technology for Teachers: Social Media for Teachers | Moodle and Web 2.0 | Scoop.it

"Earlier this week I Pinned a nice infographic from Scholastic about social media. The infographic, Social Media for Teachers, isn't terribly detailed but it could be useful for teachers who are new to social media. The infographic highlights some educators to connect with on Twitter and Pinterest. It also gives a short run-down of Twitter chats that educators should check out. The infographic is included below."


Via Teresa Pombo, sarspri
No comment yet.
Rescooped by Juergen Wagner from Education & Numérique
Scoop.it!

Getting to Know Google - Goodwill Community Foundation

Getting to Know Google - Goodwill Community Foundation | Moodle and Web 2.0 | Scoop.it

Are you aware of the many services that Google offers? This infographic, from the Goodwill Community Foundation (GFC), provides a look at some of the services. In fact the GFC website provides a wide range of materials that you may find useful. This infographic is a part of a lesson that teaches you about many of the services Google provides.


Via Beth Dichter, michel verstrepen, Terheck
Dolly Bhasin 's curator insight, December 26, 2012 3:50 AM

Google for All!

Nancy Jones's curator insight, December 27, 2012 5:39 PM

Great tool and reminder.

Rescooped by Juergen Wagner from Digital Presentations in Education
Scoop.it!

Using PowerPoint to Create Video Infographics

Using PowerPoint to Create Video Infographics | Moodle and Web 2.0 | Scoop.it

Via Baiba Svenca
No comment yet.
Rescooped by Juergen Wagner from Presentation Tools
Scoop.it!

Infographics: Who Are They and Why Are They So Important? [Presentation]

Robin Good: If you consider, like I do, "infographics" as visual presentation tools, I strongly suggest you to browse through this excellent slideshow by Robin Richards, which provides an overview of why infographics are important, gives a glimpse of their history, application and creation and gives a good insight on what makes them truly effective. 

The secret key is in "using data" to tell a story, and NOT to paint a colorful poster of cute statistical charts.

Great examples and tips are all included.


Recommended. 9/10


Original presentation: http://www.slideshare.net/ripetungi/why-are-infographics-important 


Via XPLAIN, Robin Good
No comment yet.
Rescooped by Juergen Wagner from Rapid eLearning
Scoop.it!

iLibrarian » 5 Free Online Tools to Create Your Own Infographics

iLibrarian » 5 Free Online Tools to Create Your Own Infographics | Moodle and Web 2.0 | Scoop.it


             5 Free Online Tools to Create Your Own Infographics


Via Ramon Aragon, juandoming, Jose H. Flores, Gust MEES, Jack Patterson, michel verstrepen
No comment yet.
Rescooped by Juergen Wagner from iPads, MakerEd and More in Education
Scoop.it!

Nik's Learning Technology Blog: 9 Generic activities for exploiting infographics

Nik's Learning Technology Blog: 9 Generic activities for exploiting infographics | Moodle and Web 2.0 | Scoop.it
Infographics are a great source of information and make reading information from the computer screen much easier, but just showing students an infographic and telling them to study it isn’t the most effective way to exploit the medium.

Via John Evans
No comment yet.
Rescooped by Juergen Wagner from Technology and Education Resources
Scoop.it!

How Students Can Use Timeline Infographics in the Classroom

How Students Can Use Timeline Infographics in the Classroom | Moodle and Web 2.0 | Scoop.it

As a foreign language teacher, I am always looking for innovative ways to allow my students to demonstrate what they have learned.

I want students to be able to choose a tool that brings out their creative side and, as a result, leads to a more authentic and meaningful learning experience.

Because learning a language can be difficult, I try to design a variety of activities and projects that will provide students with practice and unique opportunities to develop their language skills through the creation of their projects.


Via R.Conrath, Ed.D.
Simon J Condon's curator insight, December 2, 2016 2:54 PM
Students can use to show historical developmentioned in subjects
Yashy Tohsaku's curator insight, December 2, 2016 6:17 PM
Share your insight
Jovi Buendia's curator insight, April 22, 2017 11:09 AM
Visual and much more engaging for ELs.
Rescooped by Juergen Wagner from iGeneration - 21st Century Education (Pedagogy & Digital Innovation)
Scoop.it!

20+ Tools to Create Your Own Infographics

20+ Tools to Create Your Own Infographics | Moodle and Web 2.0 | Scoop.it
A picture is worth a thousand words – based on this, infographics would carry hundreds of thousands of words, yet if you let a reader choose between a

Via Tom D'Amico (@TDOttawa)
No comment yet.
Rescooped by Juergen Wagner from Didactics and Technology in Education
Scoop.it!

How to Create an Infographic in Under an Hour [+10 Free Templates]

How to Create an Infographic in Under an Hour [+10 Free Templates] | Moodle and Web 2.0 | Scoop.it

Wouldn't it be great if creating infographics was just as simple as writing regular ole text-based blog posts? Unfortunately, the reality is that making visual content like this usually takes a lot more time, effort, and let's face it -- skill -- than the written word. 


Usually.But considering the popularity and effectiveness of visual content in marketing today, you can't just afford to throw in the towel. That's why we decided to take all the pain and suffering out of infographic creation. 


Seriously -- don't throw in the towel just yet. You, too, can create professional-looking, high-quality infographics ... quickly! And I'm going to prove it. First things first ...


Via Jeff Domansky, Rui Guimarães Lima
Carmen Ramos's curator insight, April 12, 2015 12:36 PM

Infographiken erstellen einfach gemacht, mit Power Point

Lori Wilk's curator insight, April 14, 2015 10:04 AM

It's great to have tools to make your more #effective and #efficient that allows you to improve your #productivity. Execellent to help us to learn about creating #infographics


Mery Elvis Mt's curator insight, October 7, 2015 8:34 PM

Crear infografías genera un alto engagement, aprende como hacerlas en menos de 1 hora

Rescooped by Juergen Wagner from Teach and tech
Scoop.it!

8 steps to designing the perfect infographic | Infographic | Creative Bloq

8 steps to designing the perfect infographic | Infographic | Creative Bloq | Moodle and Web 2.0 | Scoop.it
Click the image to see the full size infographic

Via Luísa Lima
No comment yet.
Rescooped by Juergen Wagner from Technology in Today's Classroom
Scoop.it!

Creating Classroom Infographics Using these 2 Awesome Google Docs templates

Creating Classroom Infographics Using these 2 Awesome Google Docs templates | Moodle and Web 2.0 | Scoop.it

Via Tom D'Amico (@TDOttawa) , John Purificati
No comment yet.
Rescooped by Juergen Wagner from Classe inversée -- Expérimentation -- Recherches
Scoop.it!

46 Tools To Make Infographics In The Classroom

46 Tools To Make Infographics In The Classroom | Moodle and Web 2.0 | Scoop.it

Infographics are interesting–a mash of (hopefully) easily-consumed visuals (so, symbols, shapes, and images) and added relevant character-based data (so, numbers, words, and brief sentences).

The learning application for them is clear, with many academic standards–including the Common Core standards–requiring teachers to use a variety of media forms, charts, and other data for both information reading as well as general fluency...


Via Baiba Svenca, Marie-Hélène Fasquel-Erhart
maite collados's curator insight, January 14, 2014 11:24 AM

Las infografías son una herramienta muy útil por su factor visual: en poco espacio y de forma visulamente agradable y atrayente, engloba datos y relaciona conceptos.

ManufacturingStories's curator insight, July 30, 2014 7:50 AM

For more resources on Social Media & Content Curation visit http://bit.ly/1640Tbl


Cynthia Day's curator insight, July 30, 2014 2:45 PM

apps

Rescooped by Juergen Wagner from Technology and Education Resources
Scoop.it!

The Must-Have EdTech Cheat Sheet [Infographic]

The Must-Have EdTech Cheat Sheet [Infographic] | Moodle and Web 2.0 | Scoop.it
There's a whole galaxy of terminology that you should know about when it comes to education technology. From PLNs to Blended Learning to Synchronous Online Learning... it can get overwhelming.

Via Gust MEES, R.Conrath, Ed.D.
Hedda Kirstine Hornemann's curator insight, February 3, 2013 9:52 AM

Edtech cheat sheet :)

Patricia Christian's curator insight, February 3, 2013 8:14 PM

This is a nice visual summary of terms in education technology.

Roberto Ivan Ramirez's curator insight, May 7, 2013 8:10 PM

Implementos tecnológicos móviles y mezcla de entornos presenciales y virtuales para potencializar el aprendizaje, van a requerir de estrategias eficaces pedagógicas variadas y diversas para cada caso y situación concreta educativa.

Rescooped by Juergen Wagner from Languages, Learning & Technology
Scoop.it!

20+ Tools to Create Your Own Infographics

20+ Tools to Create Your Own Infographics | Moodle and Web 2.0 | Scoop.it
A picture is worth a thousand words – based on this, infographics would carry hundreds of thousands of words, yet if you let a reader choose between a full-length 1000-word article and an infographic that needs a few scroll-downs, they’d probably...

Via Rosário Durão, Evdokia Roka, sarspri
No comment yet.
Rescooped by Juergen Wagner from Creative Tools, GBL... and ESL
Scoop.it!

The 7 Styles Of Learning: Which Works For You? - Edudemic

The 7 Styles Of Learning: Which Works For You? - Edudemic | Moodle and Web 2.0 | Scoop.it

You love to learn. Your students, colleagues, and parents love to learn. But what kind of styles of learning are most effective for each party? It's about time multiple intelligences are thoroughly regarded and treated in extense in foreign language teaching


Via Ricard Garcia
No comment yet.
Rescooped by Juergen Wagner from Education et TICE
Scoop.it!

easel.ly | create and share visual ideas online

easel.ly | create and share visual ideas online | Moodle and Web 2.0 | Scoop.it

create and share visual ideas online
vhemes are visual themes. drag and drop a vheme onto your canvas for easy creation of your visual idea!


Read more:

http://www.easel.ly/


Via Gust MEES, Laurent Blanquer
No comment yet.
Scooped by Juergen Wagner
Scoop.it!

Infographic: Reining in the information deluge

Infographic: Reining in the information deluge | Moodle and Web 2.0 | Scoop.it
No comment yet.