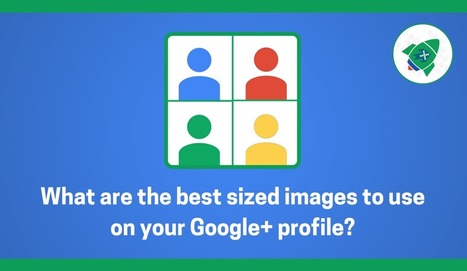

Are you wondering what size of images to use on your Google+ Profile? Well, here are the details.
Get Started for FREE
Sign up with Facebook Sign up with X
I don't have a Facebook or a X account

 Your new post is loading...

|
Scooped by Brian Yanish - MarketingHits.com |
Are you wondering what size of images to use on your Google+ Profile? Well, here are the details.
If you want someone to remember your message--in a presentation, an article, or a report--tell them a story.
Our brains are far more engaged by storytelling than a list of facts--it’s easier for us to remember stories because our brains make little distinction between an experience we are reading about and one that is actually happening. And while we've covered the importance of storytelling before, there is another element that can drive your point home even more--images. That's because visuals add a component to storytelling that text cannot: speed.

This article is interesting when it comes to social media marketing. It is important for marketers to be aware that consumers remember stories easier then lists of facts, because when marketers are choosing how to market their products they should consider this article and the information it has to offer. I agree with the fact that i remember stories more frequently then lists of facts when it comes to marketing and advertising and even when studying for school.

"HubSpot's social-media scientist Dan Zarrella found tweets with images are 94% more likely to be retweeted than tweets without." Adding images allows people to remember your message easier, and quicker!
|
|
Scooped by Brian Yanish - MarketingHits.com from consumer psychology |
"The psychology of sharing food experiences and photos via social networks launched at Social Media Week London. This is the first stage of a piece of research …"
|
|
Scooped by Brian Yanish - MarketingHits.com from Must Design |
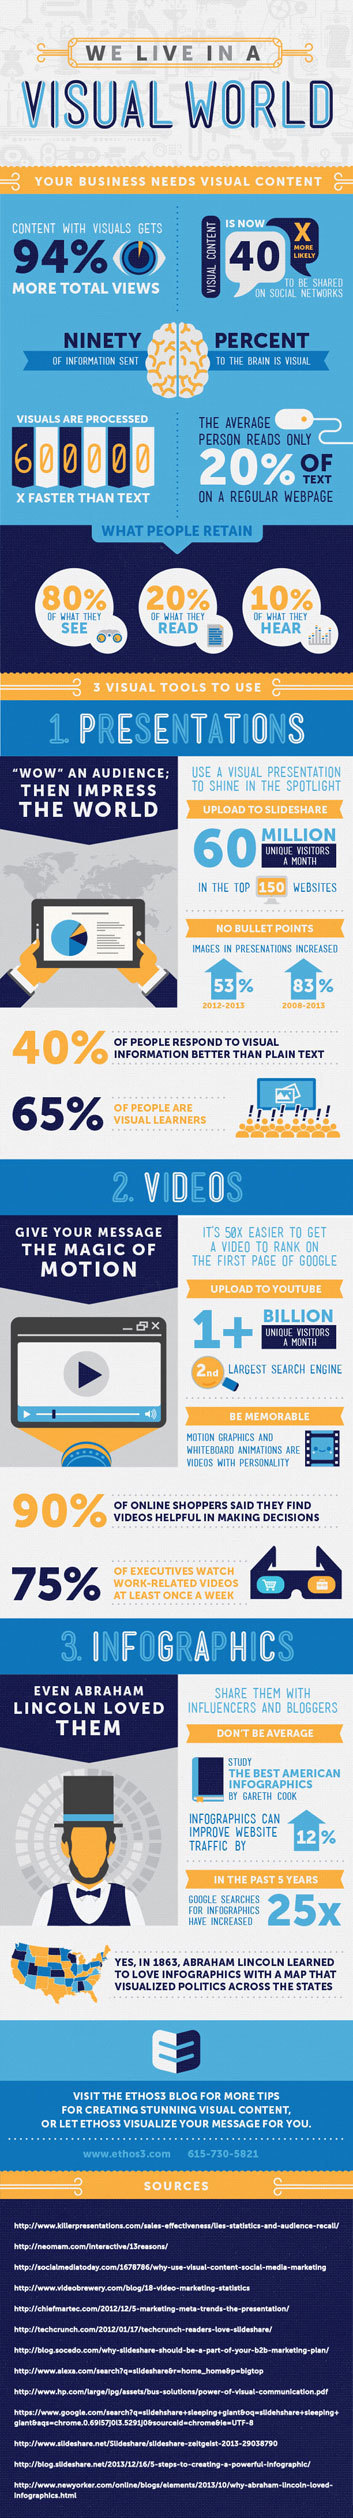
10 Reasons Visual Content will Dominate 2014 What marketing strategies will we focus on in 2014? What will we leave behind? This article takes a look at the rise of visual content - and why 2014 will dominate in 2014:
1. 90% of information transmitted to the brain is visual. Visuals are processed 60,000X faster in the brain than text.
2. Videos on landing pages increase average page conversion rates by 86%.
3. Visual content is social-media-ready and social-media-friendly. It’s easily sharable and easily palatable.
4. Businesses who market with infographics grow in traffic an average of 12% more than those who don’t.
5. Posts with visuals receive 94% more page visits and engagement than those without.
6. 60% of consumers are more likely to click on a business whose images appear in search results.
7. Clear, detailed images carry more weight than product information or customer ratings say 67% of consumers.
8. Visuals show your products without telling people about them. This allows viewers to make their own decisions without feeling pressure from your business.
9. Visuals express ideas quickly - in a snapshot. This breaks through the overwhelming clutter of online content.
10. Visuals are becoming easier and easier to create as photo editing tools become more accessible

All I can say, is thank goodness for Visuals in content! I've always been a visual person being a visual learner. Information is easier to retain and comprehend when visuals are employed as it pulls you in.
The article's statistics further supports the importance of visuals. I love visuals!

10 Razones por las que los contenidos visuales dominarán el 2014
¿En qué estrategias de marketing nos vamos a centrar en el 2014? ¿Qué vamos a dejar atrás?
Este artículo echa un vistazo al ascenso del contenido visual y por qué 2014 será el año de los elementos visuales.
.
|
|
Scooped by Brian Yanish - MarketingHits.com from visualizing social media |
![The Social Media Sizing Guide [INFOGRAPHIC] | MarketingHits | Scoop.it](https://img.scoop.it/CckOJv8XNOT0ff-LKhrRYzl72eJkfbmt4t8yenImKBVvK0kTmF0xjctABnaLJIm9)
Setting up a new Twitter profile or Facebook Page can be a time-consuming process, especially when it comes to working out the sizes of all the images you need to make your channels – or those of your clients – stand out from the crowd.
And what about the other social platforms, like Pinterest and Google+? Wouldn’t it be great if somebody could put all of this information on a single page?
Earlier this year we looked at a very thorough social media sizing cheat sheet from those nice folks at LunaMetrics and now, not only have the team at LunaMetrics revamped the look of their graphic, they’ve also updated the content so that it now includes all the latest social media sizing information for Facebook, Twitter, Google+, YouTube, LinkedIn and Pinterest.
See the infographic for all that essential sizing details...

We have posted something similar before but here is another one. These are very useful guides.