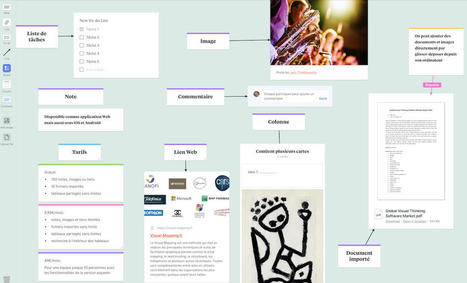

#post_excerptMilanote est un outil visuel collaboratif qui va nous permettre de créer et partager des tableaux à idées facilement et rapidement.
Via Xavier PIERENS
Get Started for FREE
Sign up with Facebook Sign up with X
I don't have a Facebook or a X account


 Your new post is loading...
 Your new post is loading...
Your new post is loading...
#post_excerptMilanote est un outil visuel collaboratif qui va nous permettre de créer et partager des tableaux à idées facilement et rapidement. Via Xavier PIERENS 
No comment yet.
Sign up to comment

Through the years, I’ve done a lot of research both offline and online. There are two big problems with doing that much research. The first is that you tend to accumulate a lot of information of various forms. Via Elodie Crespel, ChibiYuzu
|
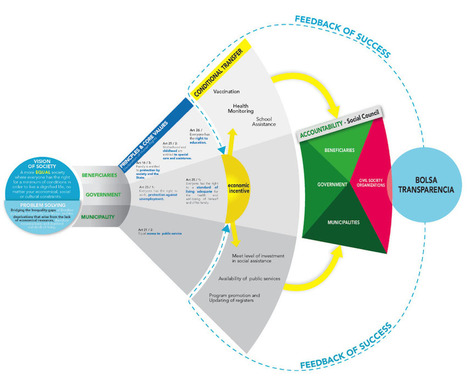
My classmates and I are in the Design for Social Innovation program because we identified problems in our communities, companies, or cultures and are keen to figure them out. But before talking about any solution or outcome, one must first frame the problem—by thoughtfully examining the system it’s part of to understand where and how to get involved. Learning to use systems thinking, a holistic approach to problem solving that emphasizes contextual understanding, has helped me with team management, project planning, creative work, and even relationships. And for wicked problems like healthcare that confront business, nature, and society, it’s proving to be imperative.So, where to even begin? “We have to invent boundaries for clarity and sanity,” advises systems thinking pioneer Donella Meadows. Sometimes a simple infographic works to tell the story. Designing visual maps and models helps us immediately find connections and describe relationships. Creating models helps in seeing the big picture and one's place within it. Via Lauren Moss

Martin (Marty) Smith's comment,
January 28, 2013 7:14 PM
I think "design" and "programming" are rushing at each other at light speed. Web pages will be made from branching if,then,else algorithms soon. Can't just drip paint on a canvas, so design's function will be making those algorithms make visual sense.

Gordon Shupe's curator insight,
February 8, 2013 6:38 AM
Info graphics don't really include digital photography, generally, but they are a fascinating way of displaying understanding, telling a story, and implying solutions.
|